My PageSpeed Score Went 59 to 97. Then 73. Then 97 Again.
Every fix, every failure, and every score swing from one afternoon inside PageSpeed Insights. If you run a business website, the lesson is not the 97.


I spend my days telling business owners that their websites are slower than they think. This week I pointed the same flashlight at my own site, and the result stung. Mobile PageSpeed score: 59. Largest Contentful Paint: 10.6 seconds.
Ten point six seconds. On a mid-range phone with a weak connection, my headline took longer to show up than it takes most people to give up and hit back. I sell visibility for a living. My own site was invisible to anyone not on fiber.
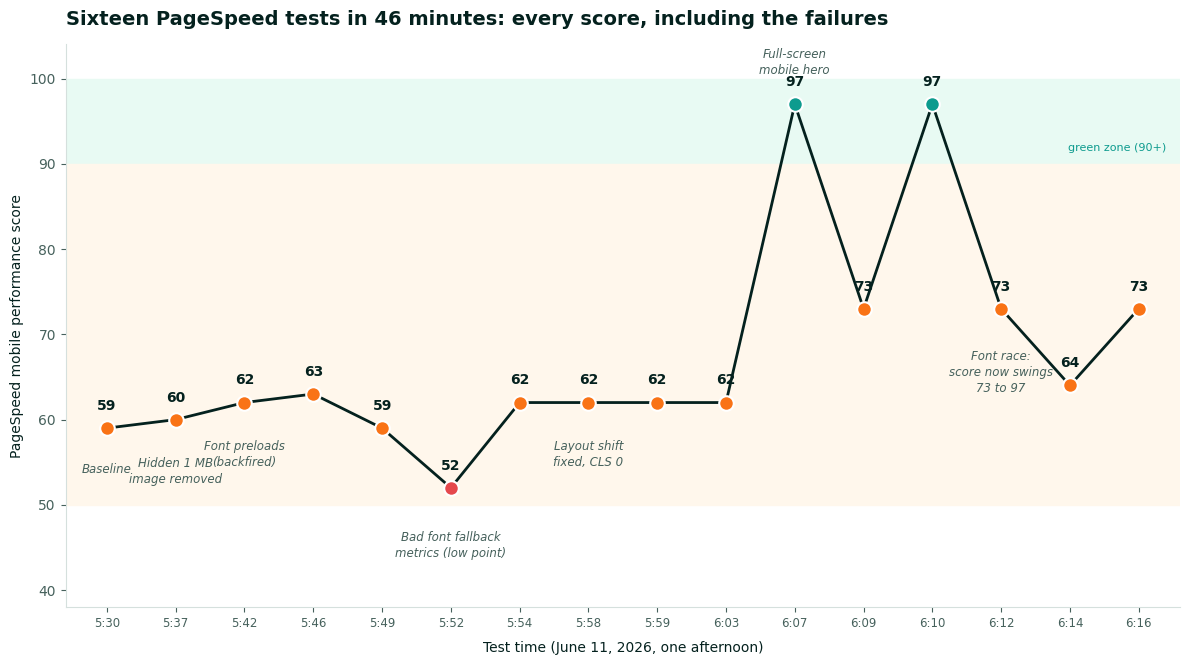
So I blocked off an afternoon, ran sixteen tests in 46 minutes, broke my site's score twice, and ended at 97. This is the full record, including the failures, because the failures taught me more than the wins. And because the way that score behaved along the way is something every business owner staring at PageSpeed Insights needs to understand.
What was actually slowing my site down
Not what I expected. I assumed I would find bloated scripts or too many fonts. The biggest problem turned out to be an image nobody could see.
My Ghost theme was still downloading its default stock cover photo on every single page load. Over 1 MB, 5000 pixels wide. Months ago I replaced that section with a custom gradient and hid the image with CSS. The catch is that hiding an image does not stop the browser from downloading it. Every visitor paid a 1 MB tax for a stock photo they never saw. That one had been sitting there the whole time, quietly burning bandwidth.
Second culprit: web fonts loaded through a third-party stylesheet. Before my page could paint anything, the browser had to contact another server, download a CSS file, and only then learn which font files it needed. That chain added roughly a full second of staring at a blank screen.
Third: layout shift, the annoying jump where a page moves while you are reading it. Some sections of my homepage are added by JavaScript after the page loads. While my site was slow, those insertions finished before anything painted, so nothing visibly jumped. The moment I made the page faster, the jumps appeared. Speed exposed a problem that slowness had been hiding. Sit with that one for a second.
The fixes that worked
Five changes carried all of the improvement.
- Deleted the invisible cover image. Over 1 MB gone from every page load. Thirty seconds of work once I knew where to look.
- Cut the font middleman. I declared the fonts directly in the page head and pointed straight at the two font files, removing the third-party stylesheet from the critical path. Render-blocking time dropped from about 1,050 ms of estimated savings to 150.
- Stopped the layout jumps. The section that gets built by JavaScript now stays invisible until it finishes assembling, then fades in. Nothing a visitor sees ever moves. Cumulative Layout Shift: zero.
- Made the mobile hero fill the screen. This was the score breakthrough, and it is sneakier than it sounds. Google times the largest visible element. A late-loading section was poking into the bottom of the phone viewport, so Google timed my page against that instead of my headline. Pushing it below the fold meant the measurement landed on the headline, which paints at 2.1 seconds. The score jumped from the low 60s to 97 on that change alone.
- Resized a vanity image. My footer photo was 2000 pixels wide, displayed at 64. Now it loads at the size it is shown.
The fixes that backfired
Two textbook optimizations made my site slower, and I want them on the record.
Font preloading failed three separate times. Every performance guide tells you to preload your font files. Every time I tried it, my first paint went from 2.1 seconds back to roughly 5.5. The high-priority font downloads were elbowing the page's main stylesheet out of the way on a constrained connection. Textbook advice, wrong for this site. I only know because I tested before and after each change, one change at a time.
Then I got clever and tried hand-tuning fallback font metrics so the temporary system font would occupy the exact same space as the real one. My guessed numbers were off, and layout shift more than doubled, dragging the score to 52. The lowest point of the whole afternoon was self-inflicted. I reverted it within minutes, again because I was testing every step.
If there is one habit to copy from this, it is that. One change, one test, look at the result. The afternoon produced sixteen data points and zero mysteries.
The results
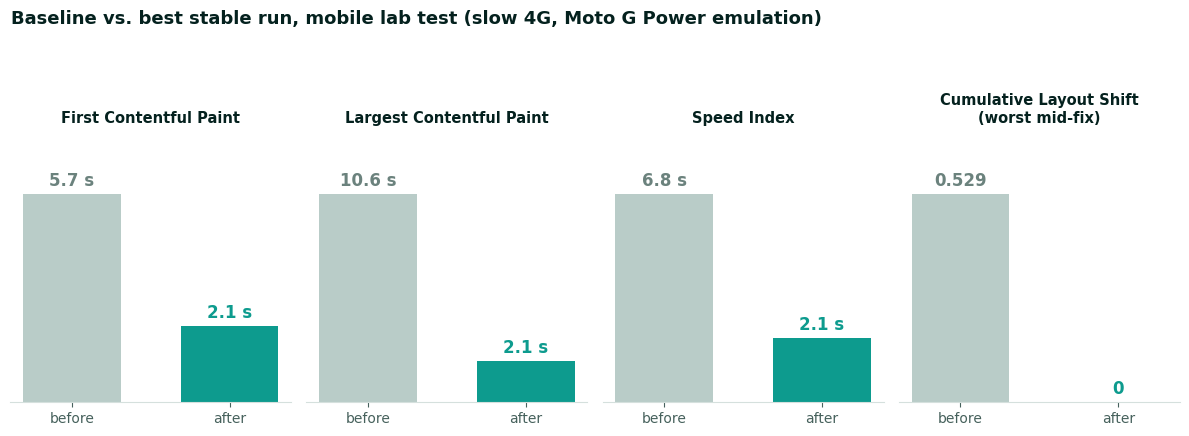
Headline visible in 2.1 seconds instead of 10.6. Speed Index from 6.8 to 2.1. Layout shift at zero. The page now weighs over a megabyte less on every load, on every page of the site.
The score would not sit still
After all the fixes, I kept testing. 97. Then 73. Then 97. Then 73 again. Same site, same code, minutes apart.
If you have ever refreshed PageSpeed Insights and watched your score move twenty points with no changes, you have met this. Nobody warns business owners about it, so the swings get misread as either broken tooling or a broken website. Usually it is neither. Four things were moving under my feet:
The test simulates a slow phone. Lab scores model a budget Android on a weak 4G connection. Useful as a stress test, but it is a simulation built from a real, unthrottled run, and small timing differences in that run get amplified by the model.
My font was winning and losing a race. I configured fonts so the brand typeface is used only if it arrives almost instantly, otherwise the page keeps a clean system font and never reflows. In the lab, that race lands differently run to run. When the brand font sneaks in, the simulation books the headline's paint at the font's simulated arrival time and the score reads 73. When it misses, 97. Real visitors on normal connections get the font and the speed. The lab can only pick one story per run.
Cache state matters. Every time I saved a change, my host purged its page cache, so the next test hit a cold server and looked slower than the steady state. A test right after deploying is the worst possible moment to judge a change.
Different test runs, different machines. Google runs these audits from rotating infrastructure. Some variance is baked in and no amount of optimization removes it.
The number that actually feeds Google's ranking systems is not any of these lab runs. It is field data: 28 days of real Chrome visitors, reported in the Core Web Vitals section at the top of the report. My site is new enough that it shows No Data there. The lab swings between 73 and 97 are an artifact of simulation. The field data, once it accumulates, will not swing like that.
The full test log
Every run from the afternoon, nothing trimmed. The two failures are in there because pretending optimization is a straight line up helps nobody.
| Time | Score | LCP | CLS | What changed |
|---|---|---|---|---|
| 5:30 | 59 | 10.6s | 0 | Baseline |
| 5:37 | 60 | 6.7s | 0.205 | Hidden 1 MB image removed, fonts off critical path |
| 5:42 | 62 | 6.7s | 0 | Font preloads added (mistake no. 1) |
| 5:46 | 63 | 6.5s | 0.205 | Preloads removed, fonts declared inline |
| 5:52 | 52 | 6.5s | 0.529 | Guessed font fallback metrics (mistake no. 2) |
| 5:54 | 62 | 6.5s | 0.245 | Reverted, font set to load-or-skip |
| 5:58 | 62 | 6.5s | 0 | Layout shift guard live |
| 6:07 | 97 | 2.1s | 0.019 | Full-screen mobile hero |
| 6:09 | 73 | 6.4s | 0.019 | Same site, font race lost |
| 6:10 | 97 | 2.1s | 0 | Fold margin tightened |
| 6:14 | 64 | 6.3s | 0 | Tried preloading again (no, really, it fails) |
| 6:16 | 73 | 6.5s | 0 | Final config, cold cache run |
The reports are public if you want to inspect them. The baseline 59, the self-inflicted 52, and the 97 with everything green.
What this means if you run a business website
First, your site is probably carrying dead weight you cannot see. Mine was a consultant's site, maintained by someone who does this professionally, and it still had a megabyte of invisible stock photo on every page. Themes and page builders leave this stuff behind constantly. You will not find it by looking at your site. You find it by measuring. It is worth measuring your homepage first, since it now pulls double duty as an AI landing page, where every wasted second costs you the most.
Second, the score is a thermometer, not the patient. Chasing 59 to 97 was worth it because each point came from removing something a real visitor would have felt: a megabyte they did not need, a blank screen they would have stared at, a page that jumped while they read it. If I had gotten the same score bump from tricks that did not change the visitor experience, it would have been worth nothing. That gap between a number that looks fine and what a visitor feels is the same reason a ranking can look healthy while the phone stops ringing.
Third, do not panic over a single test. Run it three times at a quiet moment, look at the pattern, and weight the field data section above everything once your site has enough traffic to show it. A twenty point swing between two runs minutes apart is noise. A field LCP that fails month after month is a problem with your business, because Google folds those field numbers into ranking and your visitors feel them on every visit.
And fourth, best practices are hypotheses. Font preloading is genuinely good advice for many sites. It was measurably bad for mine, three times in a row. The only optimization advice that survives contact with your website is the advice you tested on your website.
Total cost of the afternoon: zero dollars, sixteen tests, two embarrassing dips, one megabyte of stock photography sent to a better place. If your own score has been sitting in the 50s and you have been told it needs a rebuild or a new host, get a second opinion first. The fix list above came out of one afternoon of measuring, and not one item on it required either.
Frequently Asked Questions
Does my PageSpeed score actually affect my Google ranking?
A little, and not the way most people hope. Core Web Vitals are a real ranking signal, but a small one that relevance and content easily outweigh. The bigger payoff is money you can watch: a page that loads fast keeps people from leaving and books more of them. I optimize for the visitor first and treat any ranking bump as a bonus.
What PageSpeed score should I aim for?
Get into the green if you reasonably can, but do not chase a perfect 100. The score is a lab estimate, not what your customer feels on a real phone. I would rather have a 92 that loads fast on a normal connection than a 100 I bought by stripping out things customers actually use. Test on a real device before you celebrate.
Do I need a new website or host to fix a slow site?
Usually not. Almost every second I saved came from oversized images, fonts loading the wrong way, and scripts the page never used, none of which needed a rebuild or a new host. If someone quotes you a rebuild to fix speed, get a second opinion and measure first. The cheapest fixes are often the biggest.